Secular Bull Market
When Will the Next
Secular Bull Market Begin?
The Secular Bull Market vs. Secular Bear Market dynamic is an incredibly fascinating phenomenon. After all, as we've all learned by now, the stock market doesn't just go up year after year.
And as you'll see, pinpointing exactly when the next secular bull market begins is a very difficult call, until well after the fact when the benefit of hindsight kicks in.
It's difficult to say definitely, at the moment, whether we've actually been in a new long term bull market following the March 2009 lows in the U.S. stock market, or whether we're destined to, at some point, trade below that level again before the secular trend truly reverses itself.
What Exactly Is a Secular Bull Market?
The first important distinction to make is between secular markets and cyclical markets.
A secular market (bull or bear) identifies and tracks a very long term trend, as in multi-year trend. It's common for these trends to last a decade or more, sometimes upwards of two decades.
Cyclical markets, on the other hand are short to intermediate term trends that run counter to the prevailing secular trend:
- Cyclical bear market within a secular bull market - aka "correction"
- Cyclical bull market within a secular bear market - aka "bear market rally"
The second important distinction to make is between secular bull markets and secular bear markets.
A secular bull market is pretty self-explanatory - a long period of time in which the trend is fairly consistently higher stock prices. Sure, there may be pullbacks and corrections, but the dominant trend is that of increasing share prices. The great 1982-2000 secular bull market, which included the Crash of 1987, is a perfect example.
So that would mean a secular bear market is one in which the primary trend is that of ever declining share prices, right?
Not necessarily. While there may be periods of severe decline (recall the severe bear markets following the dot com bubble as well as that of the Great Recession), by taking a longer view of the entire secular bear market period, the primary trend often can be seen as a stock market that basically trades sideways for a decade or two.
Here's a really cool table provided by author Michael A. Alexander from a piece he wrote entitled Secular Market Trends. The table, which goes back all the way to 1802, illustrates a couple of important concepts - the alternating nature of these two types of secular markets, and the dramatic contrast in results that each secular trend produces (in terms of capital appreciation).

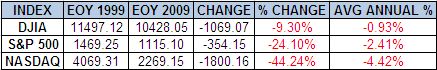
And you see something very similar by looking at the 10 years following the end of the 1982-2000 bull market, the first decade of the 21st century (popularly referred to now in investing circles as the U.S. stock market's lost decade):
Secular Market Cycles - Valuations vs Earnings
So why do we have these long term secular markets in the first place? Why do we see periods where the markets move higher for ten, fifteen, even twenty years followed by another ten, fifteen, twenty years of declining and sideways markets?
Is it a cyclical issue with the economy and the level of corporate earnings? Sort of like the Old Testament concept of seven "fat" years followed by seven "lean" years?
In a word, no.
To be sure, earnings play a role, but the real driver of these long term secular market trends seems to be valuations -
- To be more specific, a secular bull market begins with the market trading at a very low P/E multiple and is fueled by a multi-year expansion of that multiple. At the beginning stages of a secular bull market, investors are mistrustful of the market and simply unwilling to pay much for each dollar of corporate earnings.
The characteristic of a secular bull trend, however, is that over the many years that follow, investors are incrementally willing to pay more and more for each dollar of earnings. As a result, the market's overall P/E ratio continues to expand until it reaches a level that is unsustainable at best, ridiculous at worst (think "dot com bubble").
- It's at this point that the trend reverses itself, and a secular bear market ensues. Earnings may have declined in the short term, but it's not earnings that forces the market down or sideways for years at a time - it's that investors are willing to pay less and less for those earnings. At some point, the market becomes deeply undervalued (i.e. on a valuation basis), and the cycle reverses itself once again.
The Chart of the Day below illustrates this nicely . . .

The Elusive Market Bottom
There's one other key concept that's really critical to understand. And it also helps explain why identifying in real time the precise turning point from one secular trend to the next can be so difficult.
Jeffrey Saut from Raymond James has made the distinction on numerous occasions between nominal lows in the stock market and valuation lows.
You can find excerpts from one of his weekly written strategy comments (from February 2011) republished on the website Seeking Alpha in which he specifically addressed the issue of nominal lows vs valuation lows.
Specifically, Saut referenced the 1966-1982 secular bear market and noted that the stock market's nominal low occurred in December 1974 when the DJIA hit 577.60.
But get this. While the Dow never traded that low again, the market's valuation low wouldn't occur until nearly 8 years later, in the summer of 1982 (although it does appear, reviewing the Chart of the Day chart, that the P/E multiples of 1974 and 1982 were fairly similar).
The difference? Valuations.
While the December 1974 market "bottom" was lower in terms of sticker price, as it were, the mid-1982 market was actually cheaper. That's because that while corporate earnings were actually higher in 1982, investors simply weren't willing to pay very much for those earnings.
I don't have access to the exact earnings from that period, but a quick perusal of the DJIA's historical prices during the summer of 1982 shows that the closing low occurred on August 12, 1982 when the Dow closed at 776.92, or 35% higher in nominal prices compared to the 1974 low.
Predicting the Future: Prophecy vs Approximations
So where are we now? As I write this, it's been more than two years since the March 2009 lows in the U.S. stock market.
I tend to agree with Jeffrey Saut's view detailed in his February 2011 piece above. I believe that it's very likely that the nominal low has already been put in.
But my sense is that the valuation low is still to come. Recall that it took nearly eight years(!) for that process to work itself out during the last secular bear market (1966-1982).
Further, looking at Michael Alexander's table up top, the last four secular bear markets (going back all the way to the late 1880s), all had durations of between 15 and 20 years. In fact, the last secular bear market that was less than 15 years long was the 8 years leading up to the U.S. Civil War!
So although we probably still have a ways to go, it's not all bad news. Based on the long record of historical cycles, the future is fairly certain - at some point a new secular bull market will begin, although being able to call it at its precise inception will most likely be impossible.
It's also important to note that hitting a valuation low doesn't mean require a severe crash in the stock market. That's not to say there won't be significant sell-offs in the near to intermediate term, but rising corporate profits without a corresponding rise in the stock market will serve to reduce the "valuation" of the market.
And most importantly, even if we're still several years away from the next secular bull market, there are still proven ways to successfully invest in a secular bear market. But, in my opinion at least, investing for net worth places you at the mercy of long term secular trends (and works well only half the time). Investing for income over net worth, especially when doing so intelligently and creatively (i.e. Buy and Hold and Cheat), on the other hand, works well in all secular markets.


![]()


>> The Complete Guide to Selling Puts (Best Put Selling Resource on the Web)
>> Constructing Multiple Lines of Defense Into Your Put Selling Trades (How to Safely Sell Options for High Yield Income in Any Market Environment)
Option Trading and Duration Series
Part 1 >> Best Durations When Buying or Selling Options (Updated Article)
Part 2 >> The Sweet Spot Expiration Date When Selling Options
Part 3 >> Pros and Cons of Selling Weekly Options
>> Comprehensive Guide to Selling Puts on Margin
Selling Puts and Earnings Series
>> Why Bear Markets Don't Matter When You Own a Great Business (Updated Article)
Part 1 >> Selling Puts Into Earnings
Part 2 >> How to Use Earnings to Manage and Repair a Short Put Trade
Part 3 >> Selling Puts and the Earnings Calendar (Weird but Important Tip)
Mastering the Psychology of the Stock Market Series
Part 1 >> Myth of Efficient Market Hypothesis
Part 2 >> Myth of Smart Money
Part 3 >> Psychology of Secular Bull and Bear Markets
Part 4 >> How to Know When a Stock Bubble is About to Pop