Standard Deviation vs Technical Analysis
Which is Better to Use for Option Trading?
If you want to be a successful options trader, whether you're a speculator looking to improve your odds, or whether you're a long term stock investor looking to use options to lower your cost basis, you're going to want to incorporate some kind of strategy designed to give you insights about a stock's future performance.
Otherwise, you're just flipping a coin, right?
When it comes to forecasting a stock's performance - and with many trades, it's simply enough to be confident that you've got a pretty good idea what a stock WON'T do - you basically have two choices: Standard Deviation and Technical Analysis.
Disclaimer - Option Trading Bias
Now, before we jump into and compare these two approaches, let me add this quick disclaimer:
I don't consider myself an expert or hardcore user of either discipline.
The way I've come to use options myself - and advocate all over this site - is from a value investing perspective.
I want to own great companies (or "wonderful businesses" as Warren Buffett calls them), and I use options to ensure that I acquire them for substantial discounts (and sometimes for nothing at all).
The main emphasis is on owning high quality businesses. When it comes to the actual timing on the related option trades, yes, the timing is important, but it's always secondary to the quality of the actual underlying business.
Translation: I don't care what price I can get a crap company like Sears Holdings for, or how technically attractive it is, I want nothing to do with the business, the stock, or the options.
But I have learned to appreciate and use basic technical analysis to assist me in timing my value-oriented and cost basis lowering option trades.
Standard Deviation - What It Is and How Option Traders Can Use It
Standard deviation is simply a statistical method to measure how various data or samples are dispersed. When it comes to option trading, standard deviation takes the implied (expected) volatility in a stock or index and calculates how likely the underlying stock price will trade within various ranges.
To get a better explanation and demonstration, I recommend you take it from someone who actually knows what he's doing - Mr. Andersen in Bozeman, Montana (Thank God for YouTube).
NOTE: You don't need to watch much more than the first two minutes of the video to get a general, concise explanation.
Here's the chief takeaway when it comes to option trading -
By taking the implied volatility of an index or stock's options, you can theoretically calculate the probability that the index or stock will trade within specific ranges during the life of the option.
For example, the implied volatility will suggest that there's a 68% probability that the index or stock will trade within a certain range, a 95% probability that it will trade within another certain (larger) range, and a 99% probability that it will trade within another certain (still larger) range.
What those actual ranges are will depend on the actual implied volatility levels.
Knowing the statistical probabilities of future price ranges (at least as far as they are suggested by the implied volatility levels) can be beneficial when it comes to selecting the strike price(s) on your option trades.
Of course, the drawback here is that there's no guarantee that the implied volatility numbers will be an accurate reflection of a stock's future price behavior.
Technical Analysis and Option Trading
Another approach that can be used to gauge likelihoods and unlikelihoods when it comes to future price action in a stock or index is that dark art - technical analysis.
Technical analysis sometimes gets a bad rap (like me just now referring to it as a dark art), but the best technical analysts, in my opinion, are those who use it to get a general sense of a stock's likely price action over the near to intermediate term.
It's not a precise science and it's not a crystal ball.
After all, a chart is simply the historical behavior of a stock.
Now, since stocks aren't actually living, breathing creatures, a stock's behavior is based on the aggregate behavior of a crowd of traders and investors.
And where you have crowds of traders and investors, you have mass psychology.
Technical analysis then is simply the act of analyzing historical price data in an attempt to gain insights into that psychology.
And if you understand that psychology, you should presumably have a better feel for what's more likely to occur in the near to intermediate term, and what's less likely.
Let's look at a real basic example of what I'm talking about and how some relatively simple technical analysis can benefit an option trader . . .
Stock Chart #1 - KO - 2013-05-31
So in Chart #1, at market close on May 31, 2013, we see KO (Coca-Cola) sitting right on the $40 support level.
I considered it to be a support level because on numerous occasions in the recent past - i.e. in March and April - the shares traded at or near the $40 level only to experience an increase in buying demand such that the shares rebounded and began trading higher again.
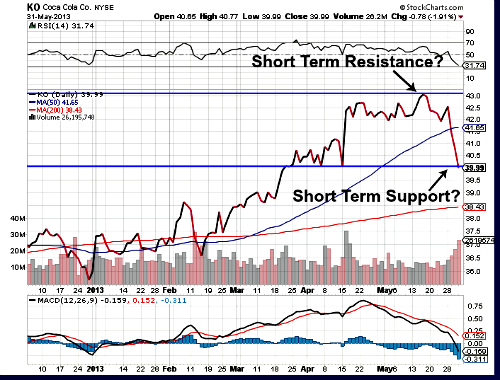
If buyers moved in at $40 on numerous occasions in the previous couple of months, then it would make sense to assume there was a decent possibility that they would do so again.
Keep in mind also that there were plenty of technically oriented traders and investors who were probably looking at the same chart. So, yes, there can sometimes be an element of self-fulfilling prophecy at work, too.
So does that guarantee the price wouldn't fall below $40/share? Of course not, but the chart does tell a story.
Now, the interesting part - how does the story continue?
Stock Chart #2 - KO - 2013-06-07
So let's pick up a week or so later and see where the stock is trading.
And we see that at market close on 2013-06-07, eight days later, KO had, in fact, bounced off that $40 support level once again:
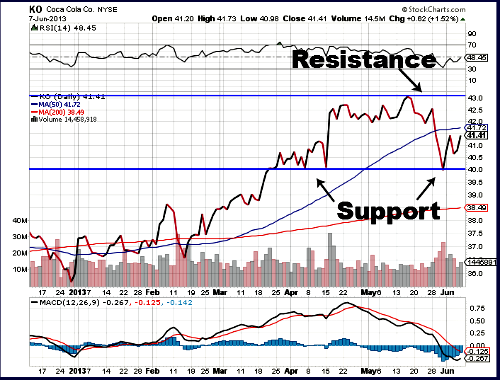
Obviously this is a textbook example, and the "stories" don't always work out so neatly, but from this example you can definitely see the potential and attractiveness of incorporating basic technical analysis into your option trading decisions.
So Which is Better - Standard Deviation or Technical Analysis?
So which is better?
It really comes down to your own personal preferences and how your mind best interprets and analyzes information.
Some people really get into mathematical and statistical models while others - like myself - prefer the "stories" we read from charts and crowd psychology.
And it may also depend on what specific option strategies you plan to employ.

HOME : Stock Options Analysis and Articles : Standard Deviation vs Technical Analysis

![]()


>> The Complete Guide to Selling Puts (Best Put Selling Resource on the Web)
>> Constructing Multiple Lines of Defense Into Your Put Selling Trades (How to Safely Sell Options for High Yield Income in Any Market Environment)
Option Trading and Duration Series
Part 1 >> Best Durations When Buying or Selling Options (Updated Article)
Part 2 >> The Sweet Spot Expiration Date When Selling Options
Part 3 >> Pros and Cons of Selling Weekly Options
>> Comprehensive Guide to Selling Puts on Margin
Selling Puts and Earnings Series
>> Why Bear Markets Don't Matter When You Own a Great Business (Updated Article)
Part 1 >> Selling Puts Into Earnings
Part 2 >> How to Use Earnings to Manage and Repair a Short Put Trade
Part 3 >> Selling Puts and the Earnings Calendar (Weird but Important Tip)
Mastering the Psychology of the Stock Market Series
Part 1 >> Myth of Efficient Market Hypothesis
Part 2 >> Myth of Smart Money
Part 3 >> Psychology of Secular Bull and Bear Markets
Part 4 >> How to Know When a Stock Bubble is About to Pop